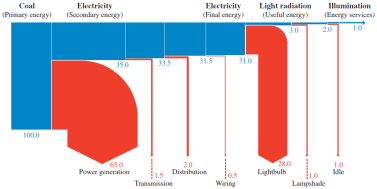
As we learned previously, energy sources go through several processes before it becomes the useful energy we use and we can provide a visual representation of this through Sankey diagram. According to the Oxford IB Physics textbook, Sankey diagram is a visual representation of the flow of the energy in a device or in a process.
When drawing a Sankey diagram, there are some rules to remember:
- Each energy source and loss in the process is represented by an arrow.
- The diagram is drawn to scale with the width of an arrow being proportional to the amount of energy it represents.
- The energy flow is drawn from left to right.
- When energy is lost from the system it moves to the top or bottom of the diagram.
- Power transfers as well as energy flows can be represented.
If we flow these rules, then we can come up with a Sankey diagram for a lamp.
From the Sankey diagram, we can notice that large portion of the total energy is leaked through power generation and internal energy of light bulb. Any energy that is leaked and no longer useful is called degraded energy. Hence through the Sankey diagram, we can also know the efficiency of energies.

